Ceph Crush-Compat Balancer Lab
Contents
Introduction⌗
Following on from the Ceph Upmap Balancer Lab this will run a similar test but using the crush-compat balancer mode instead. This can either be done as a standalone lab, or as a follow on to the Upmap lab.
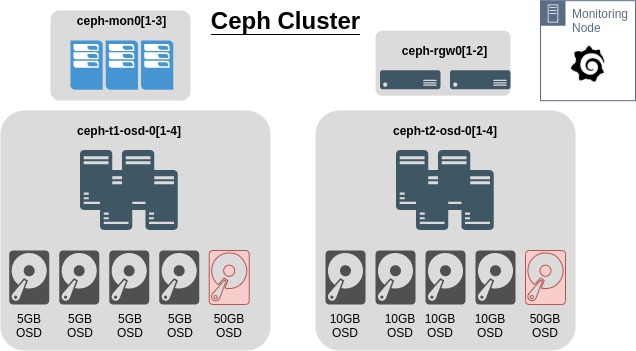
Using the Ceph Octopus lab setup previously with RadosGW nodes, this will attempt to simulate a cluster where OSD utilisation is skewed. In the cluster, each node has an extra 50G OSD to help try and skew the usage percentages on the OSDs.
This is the current configuration of the cluster
Test Setup⌗
In summary, the cluster will have data added to it using s3cmd. There will be two buckets created, one for ISO’s and other large images, and another for loads of photos and other small files.
Requirements⌗
- Ensure the Ceph balancer is off
# ceph balancer off
# ceph balancer status
- Example output. The key is to ensure
"active": false{ "active": false, "last_optimize_duration": "0:00:00.012292", "last_optimize_started": "Fri Jan 15 09:50:40 2021", "mode": "upmap", "optimize_result": "Unable to find further optimization, or pool(s) pg_num is decreasing, or distribution is already perfect", "plans": [] }
Setup s3cmd⌗
- Install s3cmd
# dnf install s3cmd
- Configure s3cmd to connect to the cluster using the keys created in this previous step
# cat <<EOF > ~/.ceph_s3cfg
[default]
access_key = 4IMSY2D3RPWW7VB7ECPB
secret_key = 7AuFEvU9HKa4WB6BjfuTlZEDv6t1oHKhQ01zmIDo
host_base = ceph-rgw01.ceph.lab
# If wildcard DNS is configured
# host_bucket = %(bucket)s.ceph-rgw01.ceph.lab
# If no wildcrds DNS
host_bucket = ceph-rgw01.ceph.lab
# If a proxy host is needed to reach the RGW nodes
#proxy_host = 192.168.0.15
#proxy_port = 8888
# If SSL has not been enabled on RGW
use_https = False
human_readable_sizes = True
EOF
Modify ~/.ceph_s3cfg as required. Alternatively modify ~/.s3cfg if this will be the only cluster s3cmd will connect to.
- Create two buckets
# s3cmd -c ~/.ceph_s3cfg mb s3://isos-2
# s3cmd -c ~/.ceph_s3cfg mb s3://photos-2
Seed Test Data⌗
- Sync local directories via s3cmd
This will probably take a while, depending on the amount of data, speed of the Ceph drives etc. May be useful to setup a custom Grafana Dashboard to ensure Crush-Compat is working as intended (if this has not already been done).
# s3cmd -c ~/.ceph_s3cfg sync /var/lib/libvirt/images/iso/ s3://isos-2/
# s3cmd -c ~/.ceph_s3cfg sync ~/Photos s3://photos-2/
- Check files are accessible
# s3cmd -c ~/.ceph_s3cfg ls s3://isos-2/
2021-01-14 10:30    858783744  s3://isos-2/CentOS-7-x86_64-GenericCloud.qcow2
- Check the size of the buckets
# s3cmd -c ~/.ceph_s3cfg du s3://isos-2/
12G      12 objects s3://isos-2/
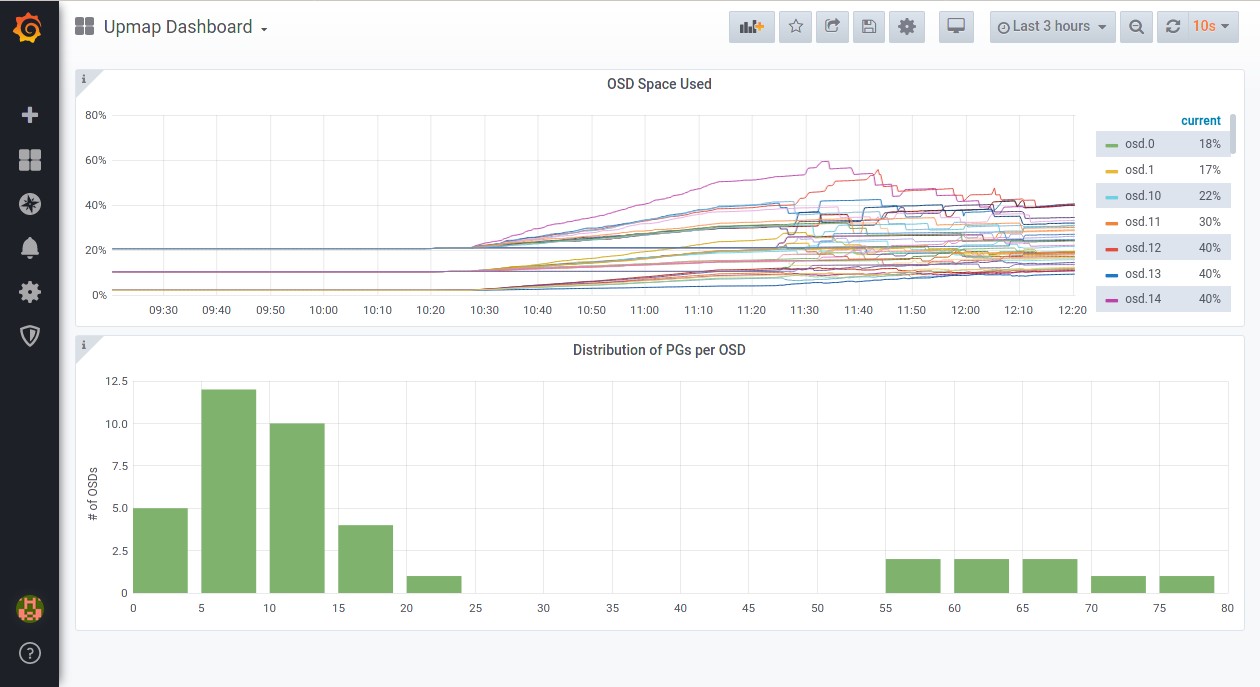
Setup Custom Grafana Dashboard⌗
Using either the default Grafana setup or the monitoring set up here, log into Grafana as admin
- Import a new dashboard from this JSON
{
  "annotations": {
    "list": [
      {
        "builtIn": 1,
        "datasource": "-- Grafana --",
        "enable": true,
        "hide": true,
        "iconColor": "rgba(0, 211, 255, 1)",
        "name": "Annotations & Alerts",
        "type": "dashboard"
      }
    ]
  },
  "editable": true,
  "gnetId": null,
  "graphTooltip": 0,
  "id": 16,
  "links": [],
  "panels": [
    {
      "aliasColors": {},
      "bars": false,
      "dashLength": 10,
      "dashes": false,
      "datasource": "Dashboard1",
      "decimals": 0,
      "description": "Space used on each OSD represented as a percentage of total space available",
      "fill": 0,
      "fillGradient": 0,
      "gridPos": {
        "h": 7,
        "w": 24,
        "x": 0,
        "y": 0
      },
      "hiddenSeries": false,
      "id": 4,
      "legend": {
        "alignAsTable": true,
        "avg": false,
        "current": true,
        "max": false,
        "min": false,
        "rightSide": true,
        "show": true,
        "sort": "current",
        "sortDesc": true,
        "total": false,
        "values": true
      },
      "lines": true,
      "linewidth": 1,
      "nullPointMode": "null",
      "options": {
        "dataLinks": []
      },
      "percentage": false,
      "pointradius": 2,
      "points": false,
      "renderer": "flot",
      "seriesOverrides": [],
      "spaceLength": 10,
      "stack": false,
      "steppedLine": false,
      "targets": [
        {
          "expr": "(ceph_osd_stat_bytes_used{instance=~\"$mgr\"}  / ceph_osd_stat_bytes{instance=~\"$mgr\"} * 100)",
          "instant": false,
          "legendFormat": "{{ ceph_daemon }}",
          "refId": "A"
        }
      ],
      "thresholds": [],
      "timeFrom": null,
      "timeRegions": [],
      "timeShift": null,
      "title": "OSD Space Used",
      "tooltip": {
        "shared": true,
        "sort": 2,
        "value_type": "individual"
      },
      "type": "graph",
      "xaxis": {
        "buckets": 25,
        "min": null,
        "mode": "time",
        "name": null,
        "show": true,
        "values": []
      },
      "yaxes": [
        {
          "format": "percent",
          "label": null,
          "logBase": 1,
          "max": null,
          "min": null,
          "show": true
        },
        {
          "decimals": null,
          "format": "short",
          "label": "",
          "logBase": 1,
          "max": null,
          "min": null,
          "show": true
        }
      ],
      "yaxis": {
        "align": false,
        "alignLevel": null
      }
    },
    {
      "aliasColors": {},
      "bars": true,
      "dashLength": 10,
      "dashes": false,
      "datasource": "Dashboard1",
      "description": "Each bar indicates the number of OSD's that have a PG count in a specific range as shown on the x axis.",
      "fill": 1,
      "fillGradient": 0,
      "gridPos": {
        "h": 8,
        "w": 24,
        "x": 0,
        "y": 7
      },
      "hiddenSeries": false,
      "id": 2,
      "legend": {
        "avg": false,
        "current": false,
        "max": false,
        "min": false,
        "show": false,
        "total": false,
        "values": false
      },
      "lines": false,
      "linewidth": 1,
      "nullPointMode": "null",
      "options": {
        "dataLinks": []
      },
      "percentage": false,
      "pointradius": 2,
      "points": false,
      "renderer": "flot",
      "seriesOverrides": [],
      "spaceLength": 10,
      "stack": false,
      "steppedLine": false,
      "targets": [
        {
          "expr": "ceph_osd_numpg",
          "instant": true,
          "legendFormat": "PGs per OSD",
          "refId": "A"
        }
      ],
      "thresholds": [],
      "timeFrom": null,
      "timeRegions": [],
      "timeShift": null,
      "title": "Distribution of PGs per OSD",
      "tooltip": {
        "shared": false,
        "sort": 0,
        "value_type": "individual"
      },
      "type": "graph",
      "xaxis": {
        "buckets": 20,
        "min": null,
        "mode": "histogram",
        "name": null,
        "show": true,
        "values": []
      },
      "yaxes": [
        {
          "format": "short",
          "label": "# of OSDs",
          "logBase": 1,
          "max": null,
          "min": null,
          "show": true
        },
        {
          "format": "short",
          "label": null,
          "logBase": 1,
          "max": null,
          "min": null,
          "show": true
        }
      ],
      "yaxis": {
        "align": false,
        "alignLevel": null
      }
    }
  ],
  "refresh": "10s",
  "schemaVersion": 22,
  "style": "dark",
  "tags": [],
  "templating": {
    "list": [
      {
        "allValue": null,
        "current": {
          "text": "ceph-mon02:9283",
          "value": "ceph-mon02:9283"
        },
        "datasource": "Dashboard1",
        "definition": "label_values(ceph_osd_stat_bytes_used, instance)",
        "hide": 0,
        "includeAll": false,
        "label": "mgr",
        "multi": false,
        "name": "mgr",
        "options": [],
        "query": "label_values(ceph_osd_stat_bytes_used, instance)",
        "refresh": 2,
        "regex": "",
        "skipUrlSync": false,
        "sort": 0,
        "tagValuesQuery": "",
        "tags": [],
        "tagsQuery": "",
        "type": "query",
        "useTags": false
      }
    ]
  },
  "time": {
    "from": "now-1h",
    "to": "now"
  },
  "timepicker": {
    "refresh_intervals": [
      "5s",
      "10s",
      "30s",
      "1m",
      "5m",
      "15m",
      "30m",
      "1h",
      "2h",
      "1d"
    ]
  },
  "timezone": "",
  "title": "Upmap Dashboard",
  "uid": "yU-29mBMk",
  "version": 5
}
- The new dashboard should look something like this
Enable Crush-Compat Balancer⌗
Steps below will be following the instructions from Ceph docs to enable the crush-compat balancer.
Current State of the Cluster⌗
With 3 OSDs above 85% utilisation and the lowest OSDs at ~50% utilisation. This is due to the lab being a follow on from the upmap balancer lab.
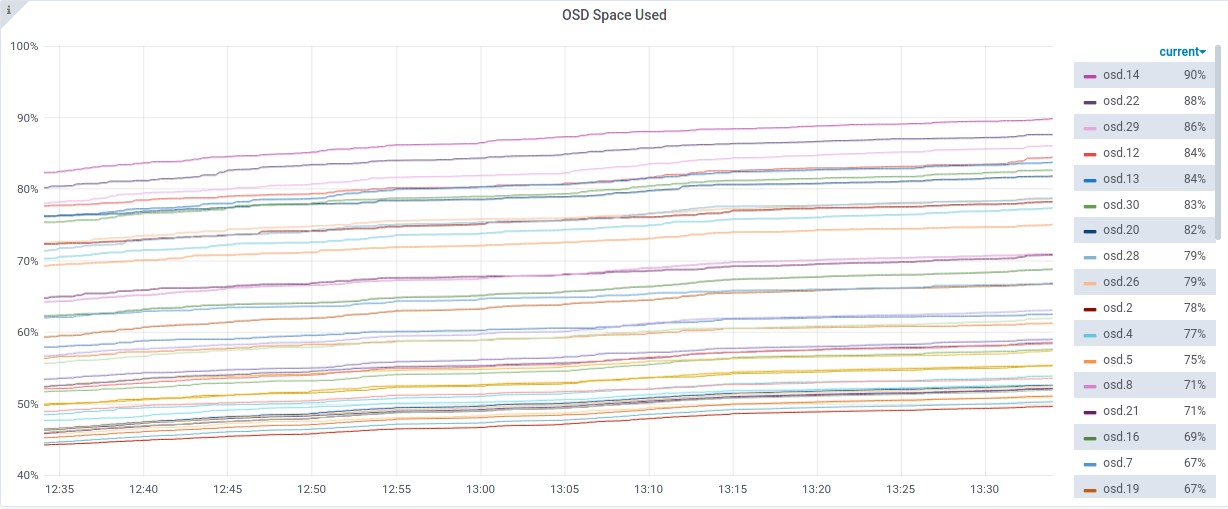
- Most utilised OSDs
# ceph osd df | sort -nr -k 17 | head -n 5
ID  CLASS  WEIGHT   REWEIGHT  SIZE     RAW USE  DATA     OMAP     META      AVAIL    %USE   VAR   PGS  STATUS
14    hdd  0.00490   1.00000  5.0 GiB  4.5 GiB  3.5 GiB  149 KiB  1024 MiB  510 MiB  90.04  1.58   16      up
22    hdd  0.00490   1.00000  5.0 GiB  4.4 GiB  3.4 GiB  164 KiB  1024 MiB  630 MiB  87.69  1.54   19      up
29    hdd  0.00490   1.00000  5.0 GiB  4.3 GiB  3.3 GiB  1.1 MiB  1023 MiB  708 MiB  86.16  1.52   20      up
12    hdd  0.00490   1.00000  5.0 GiB  4.2 GiB  3.2 GiB  661 KiB  1023 MiB  787 MiB  84.63  1.49   21      up
13    hdd  0.00490   1.00000  5.0 GiB  4.2 GiB  3.2 GiB  137 KiB  1024 MiB  829 MiB  83.79  1.47   18      up
- Least utilised OSDs
# ceph osd df | sort -n -k 17 | head -n 7
ID  CLASS  WEIGHT   REWEIGHT  SIZE     RAW USE  DATA     OMAP     META      AVAIL    %USE   VAR   PGS  STATUS
34    hdd  0.04880   1.00000   50 GiB   25 GiB   24 GiB  1.9 MiB  1022 MiB   25 GiB  49.85  0.88  155      up
32    hdd  0.04880   1.00000   50 GiB   25 GiB   24 GiB  3.4 MiB  1021 MiB   25 GiB  50.50  0.89  142      up
24    hdd  0.00980   1.00000   10 GiB  5.1 GiB  4.1 GiB  206 KiB  1024 MiB  4.9 GiB  51.04  0.90   26      up
33    hdd  0.04880   1.00000   50 GiB   26 GiB   25 GiB  2.4 MiB  1022 MiB   24 GiB  51.29  0.90  148      up
38    hdd  0.04880   1.00000   50 GiB   26 GiB   25 GiB  1.5 MiB  1023 MiB   24 GiB  52.13  0.92  152      up
Starting the crush-compat Balancer⌗
- Set the balancer mode to
crush-compat
# ceph balancer mode crush-compat
- Confirm this has been set
# ceph balancer status
Example output
{
    "active": false,
    "last_optimize_duration": "0:00:00.012292",
    "last_optimize_started": "Fri Jan 15 09:50:40 2021",
    "mode": "crush-compat",
    "optimize_result": "Unable to find further optimization, or pool(s) pg_num is decreasing, or distribution is already perfect",
    "plans": []
}
Start the balancer
# ceph balancer on
- Check the balancer is running
# ceph balancer status
- Example output
{
    "active": true,
    "last_optimize_duration": "0:00:00.446920",
    "last_optimize_started": "Fri Jan 15 13:42:59 2021",
    "mode": "crush-compat",
    "optimize_result": "Optimization plan created successfully",
    "plans": []
}
At this point the cluster will start rebalancing data.
ceph -swill show PGs being remapped to optimise data placement. The grafana graph should start to show the OSD utilisation percentages averaging out.
- Once the balancer has completed, it will show a message similar to below. All I/O was stopped on the cluster during the rebalance.
# ceph balancer status
- Example output
{
    "active": true,
    "last_optimize_duration": "0:00:00.775223",
    "last_optimize_started": "Fri Jan 15 14:05:14 2021",
    "mode": "crush-compat",
    "optimize_result": "Unable to find further optimization, change balancer mode and retry might help",
    "plans": []
}
Summary⌗
Data utilisation across the cluster is a bit better, with the highest OSD usage at 87% and lowest at 49%.

Although this doesn’t seem as efficient as the upmap balancer, it may be the test at fault for not starting from scratch, as when changing the balancer mode back to
upmapproduces this is the message:{ "active": true, "last_optimize_duration": "0:00:00.027171", "last_optimize_started": "Fri Jan 15 14:11:23 2021", "mode": "upmap", "optimize_result": "Unable to find further optimization, or pool(s) pg_num is decreasing, or distribution is already perfect", "plans": [] }
Considering it unlikely that there would be drives 10x larger than others in the same CRUSH hierarchy in a production environment, the distribution of data across the available OSDs appears fairly balanced.
Cleanup⌗
To clean up this lab, use the script here.